“Happy New Year! In 2012 I resolve to lose weight (again).”
Well I resolved to lose weight every year since at least 2005 and some years I succeeded. One tool I require for this is a spreadsheet to accurately record of my weight. I use Excel for this and I’ve produced some Excel Body Weight Templates for making new sheets annually.
Introduction
I record my weight on a DAILY, yes DAILY, basis. I know all those slimming clubs advise against measuring weight daily but to me that is unscientific. High definition pictures are better than low definition ones and weighing every day gives a good weight definition. Anyone would think that the act of measuring weight caused it to change. (I know Quantum Physicists have their doubts.)
Being scientific requires not just the measurements written down somewhere but a graph to give a picture of what is happening over time. I want to see if my weight is actually heading down or up or staying put. During this time I have come down from my heaviest of 15st (95.25kgs) in 2005 and again in July 2007 to 13st 4lbs (84.36kgs) in the same year. Then I rose again to 14st 7lbs (92kgs) and came down to 13st 2lbs (83.46kgs) in February 2010. Now I have risen again to 14st (88.9kgs) a weight I swore I would never see again.
(Note to self: I need to be more scientific about regulating the calories I consume.)
For me as a Microsoft Excel user for many years, Excel was my tool of choice for recording and plotting the data. The rest of this post explains my method for collecting the data and the use of Excel Body Weight Templates to start a new record annually. Ultimately it offers Excel Body Weight Templates – files that you can download to use with your Excel software so you can record your measurements in like manner.
Having decided on the tool for recording the data I then had to decide when I would measure my weight. I chose first thing in the morning, before eating or drinking, after visiting the bathroom and without clothing (I keep my hat specs on). This way I get the feel-good-factor of seeing my lowest possible weight each day. (We lose up to 1.5kgs at night due to exhaling moisture in our breath and urinating.) The point here is not to come up with an exact daily weight – it’s impossible. Our weight fluctuates up and down 2 or 3 pounds throughout the day. The point is to try and arrive at a consistent set of measurements that can be used to display a meaningful average weight situation, over time, on a graph.
MORE ABOUT USING EXCEL BODY WEIGHT TEMPLATES
Note: I’m not planning to give a long lecture on the use of Excel. I expect people to understand how to use it by following the MS Office Help process.
I have had seven years to try and perfect the process and have prepared four down-loadable Excel Body Weight Templates for different Excel versions and metric/imperial measurements. Just click on a file name below to down-load one of these Excel Body Weight Templates:
- MyWeightInkgs.xls – for people who weigh themselves using a metric scale and use older versions of Excel (97-2003).
- MyWeightInStonesAndPounds.xls – for people who weigh themselves using an imperial scale and use older versions of Excel (97-2003).
- MyWeightInkgs.xlsx – for people who weigh themselves using a metric scale and use Excel 2007 or 2010.
- MyWeightInStonesAndPounds.xlsx – for people who weigh themselves using an imperial scale and use Excel 2007 or 2010.
NOTE: Once you have got these Excel Body Weight Templates into Excel you can save them as templates by changing the “Save as type” to xlt or xltx as appropriate in the Save dialog.
Having clicked on the links above you may be given the following options (at least in IE9 on Windows 7):
- Run – select this and if you have a suitable version of Excel installed it should open and display your chosen file.
- Save – select this and the file should be saved in your default download folder where you can find it later.
- Save as – select this and you can choose where to save the file.
I should point out that there are three spreadsheets in the workbook:
- Data is entered on one sheet of the workbook entitled Measurements.
- The graph mentioned above is on a second sheet entitled Bar Chart.
- A third sheet has a separate graph reflecting the rate of change of weight entitled Rate of Change.
ENTERING YOUR DATA
When you have the file running click on the Measurements tab and you will see one of the views below:


Each day I find myself in one of three situations:
- I am able to weigh myself and the food I ate on the previous day was normal.
- I am able to weigh myself but the food I ate on the previous day was excessive, e.g. due to dining out in the evening.
- I am unable to weigh myself, e.g. I am on holiday and there are no scales available.
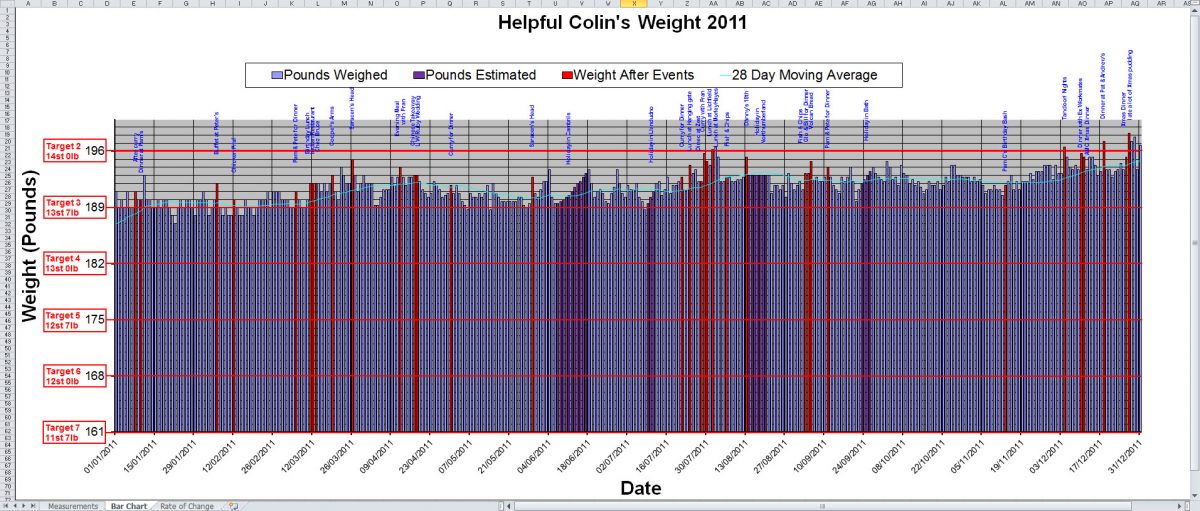
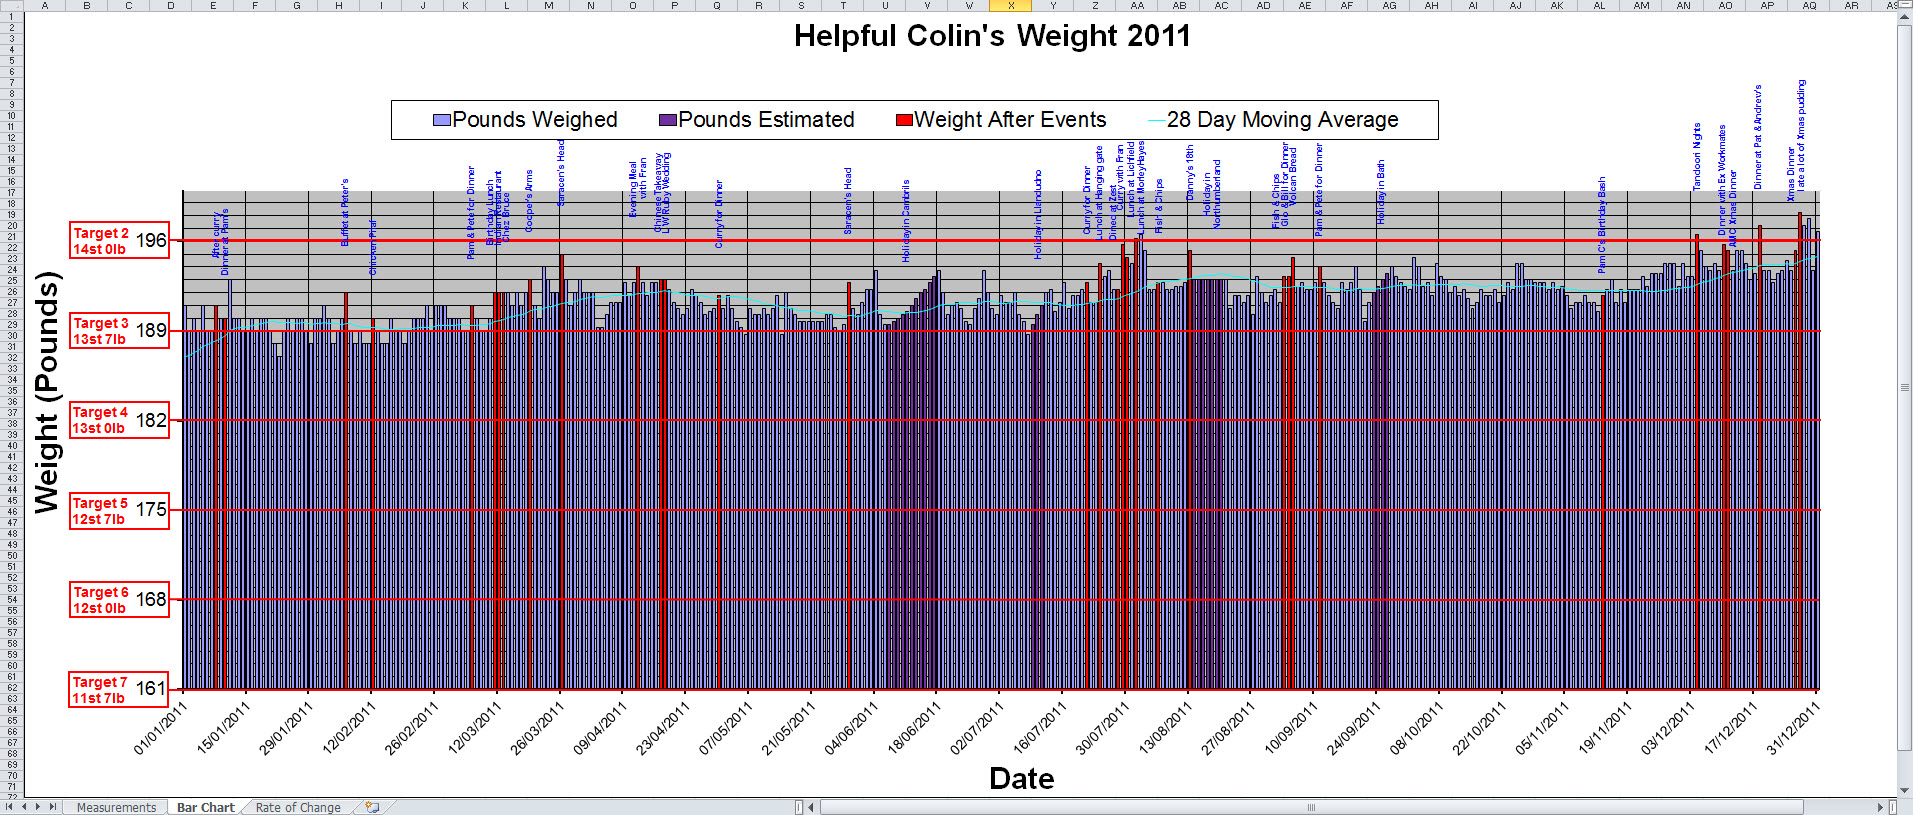
Consequently I have three sets of columns on the Measurements sheet to record the data accordingly and it is all brought together with a bar graph, on a separate sheet, using three different colours for the three different types of data thus:
- Normal measured weight is shown in blue. (Labelled: “Actual Weight”.)
- Excessive weight is shown in red. (Labelled: “Weight After Events”.)
- When I can’t weigh myself I estimate it and show it in purple. (Labelled: “Estimated Weight”.) e.g. If my weight increases 5lbs while on a 10 day vacation I will estimate that I have put on half a pound per day and add that data to the spreadsheet on my return.
As well as a bar graph there is a line graph in cyan overlaid which shows a rolling average weight based on the previous 28 days. Since the graph as a whole runs from 1st January to 31st December (a new workbook and graph are used each year) data has to be entered from the 4th December on the previous year to give the rolling average any meaning at the start of the year. Anyone entering data on this spreadsheet for the first time is advised to enter data for their starting date and enter the same data for each of the preceding 28 days so that their rolling average is about right to start with. In following years the data for the last 28 days (from the 4th to 31st December) is manually copied from the end of the old year to the beginning of the new year’s sheet.
Row 1 is there to display a title for the sheet and is supplied with the words My Weight 2012. It is not locked so you can edit it to display your name and the date can be changed when you use it in future years.
You will see that column A has days of the week throughout the year and column B has the date of each day throughout the year. Note that 2012 is a Leap Year so there are 366 + 28 rows over which all the formulae extend. When you re-use the template for an ordinary year just replace the days and dates with 365 + 28 rows worth and don’t be concerned that there is an extra row of formulae. Remember to keep a copy of the original file safe to use as a template in future years.
e.g. When 2013 arrives load the original workbook you down-loaded into Excel then:
- Alter the title on row 1 to reflect 2013.
- Check on you calendar what the day of the week 04/12/2012 falls on and enter the first three letters at cell A4 on the metric sheet or A5 on the imperial sheet.
- Enter 04/12/2012 at B4 on the metric sheet or B5 on the imperial sheet.
- Select cells A4 and B4 or A5 and B5 according to the sheet used.
- Move the cursor, now in the form of a white cross, to the bottom right corner of the selection until a black cross is seen. Hold down the left mouse button and drag down until the sheet scrolls up to display the end of the year. If you go too far just go back up before you let go of the mouse button. If you end up with dates going past the end of the year just clear the cell contents.
I have locked the cells which don’t have to be altered just so that you don’t accidentally delete formulae, etc. The locking password is no secret but if you unlock cells and then mess it up don’t come running to me. The password is: locker
If you weigh yourself using a Metric Scale (kgs):
- Enter your regular measurements in kilograms in the blue column.
- If you are extra heavy after a special meal put it in the red column.
- If you have to guess your weight put it in the purple column.
If you weigh yourself using an Imperial Scale (st & lb):
- Enter your regular measurements in stones and pounds in the two blue columns.
- If you are extra heavy after a special meal put it in the two red columns.
- If you have to guess your weight put it in the two purple columns.
- If you live in, for example, the USA where you measure your weight in pounds only, then just put your data in the pounds columns and leave the Stones values set to zero.
You will see there is a Notes column on the far right where you can enter any text, e.g. Went to restaurant; Holiday in Majorca; etc..
DON’T FORGET TO SAVE YOUR WORKBOOK AFTER ENTERING YOUR DATA.
Be organized and prepare a My Weight folder in your documents folder to keep your annual workbooks in.
BAR CHART
When you are ready to look at the graph click on the Bar Chart tab.
You may or may not see any bars representing your weight. You need to have the Bar Chart display a weight range which goes from slightly below your minimum expected weight to slightly above your maximum expected weight. Anything outside of that range will be wasted screen space and won’t give you the best visual definition of your weight variations.
The files I have made available cover the range 70kgs to 100kgs or 154lbs to 220lbs (i.e. 11st to 15st 10lbs). Note the X (horizontal axis) crosses the Y axis at 70kgs or 154lbs. If you have to adjust the Y axis you are advised to adjust this crossing point too.
If your weight lies outside this range you will have to alter the scale on the Y axis (vertical axis) of the chart as indicated below:
- If your weight is below this weight range you will need to adjust the minimum Y axis value just to get your weight to show on the chart.
- If your weight is above this weight range you will need to adjust the maximum Y axis value to see the tops of your bars.
ADJUSTING THE VERTICAL “Y” AXIS
To change the Y axis values you must Format the Y axis. Point to one of the numbers on the scale at the side of the Y axis (one which is not overlaid by a target) and click on it with the Right mouse button to bring up a context menu. In Excel 2010 it will look like one of the images below.
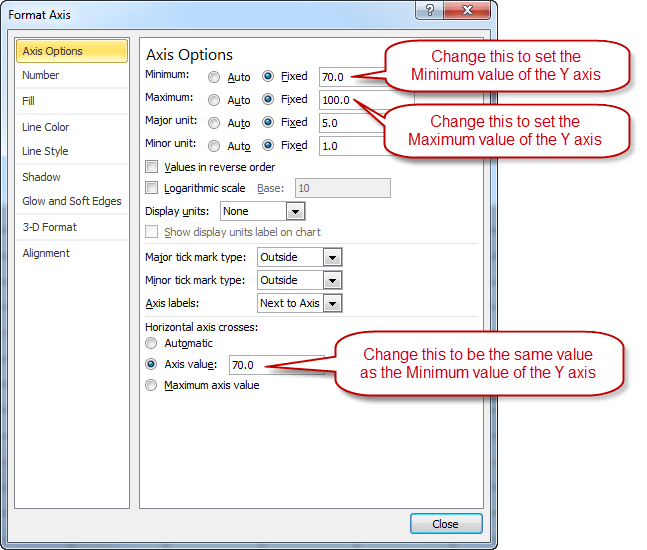
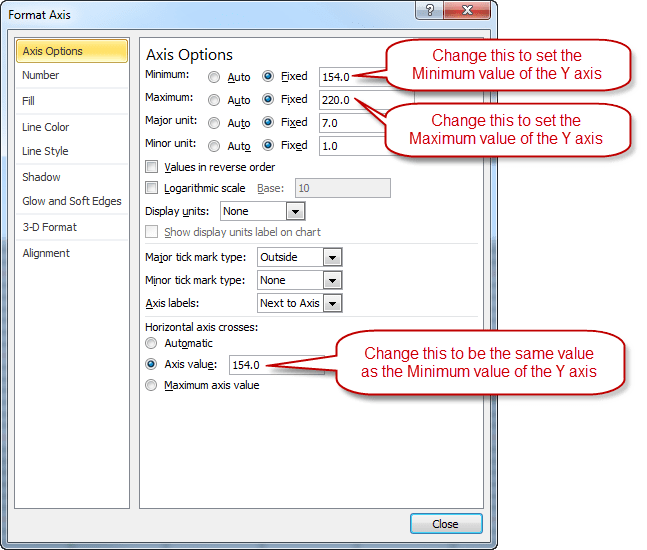
Both images above are essentially the same, taken from Excel 2010, except the top one is what you will see when the scale is in kilograms and the bottom one is what you will see when the scale is in pounds. (See instructions on the Help page to see them enlarged.) I hope you see something similar with other versions of Excel.
Under the heading “Horizontal axis crosses:” set the axis value to the same value as the Minimum axis value. This will keep the horizontal X axis at the bottom of the chart.
Close the Format Axis window when you’re done.
NOTE: If your weight goes off the chart with the passage of time you will have to adjust the Y axis again.
This is the time to stretch or shrink the vertical size of the chart if you’re not happy with its shape before you set the positions of the targets.
TARGETS
I have also included three target lines which overlay the bar chart. Their purpose is to indicate to you what your future targets are if you are trying to lose (or gain) weight. They are not part of the Excel calculating process and are freely drawn on top of the bar chart and can be moved around or deleted as you wish. The red text in the rectangular box can be edited by clicking on it. The black text you can see in the box belongs to the Y axis scale. I expect you would only want to move the targets up and down and keep them vertically aligned. Do this by first clicking on the horizontal red line of the target to get the line and the box selected together. Then whilst holding down the left mouse button also press the shift key. This will prevent the target from being moved anywhere that is NOT directly vertical or horizontal from its starting position.
To delete a target just select it and press the delete key.
NOTES WRITTEN ON THE BAR CHART
You will also find some blue overlaid vertical text on the Bar Chart. These are just casual notes similar to ones you might put in the Notes column on the Measurements sheet. I just use them to give reasons for Weight After Events or Estimated Weight. If you click on one you will select it and you can pop your cursor in there and edit it. Also when selected you can grab the edge with the mouse when you see the 4 way arrow and move it around. If you hold down the Ctrl key after you grab it you can pull a copy away from the original. This is the easiest way to get more text boxes which you can then edit.
QUIRKY BITS
The 28 Day Moving Average line on the Bar Chart is programmed to drop to zero on future days for which there isn’t any weight data yet, else it would carry on horizontally from its last plotted point and look like it was predicting the future.
The Rate of Change line graph has an automatic Y axis scale so you will see this vary from day to day as your weight fluctuates.
Good luck. Send a comment if you have a problem using these templates.
ADDENDUM
It is now 9th July 2015 and I weigh 12st 11lb. This is my lowest weight in decades and I’m heading for 12st 7lb – my next target weight. My BMI is 25.68 kg/m2.
Leave a Reply