Tag: weight
-
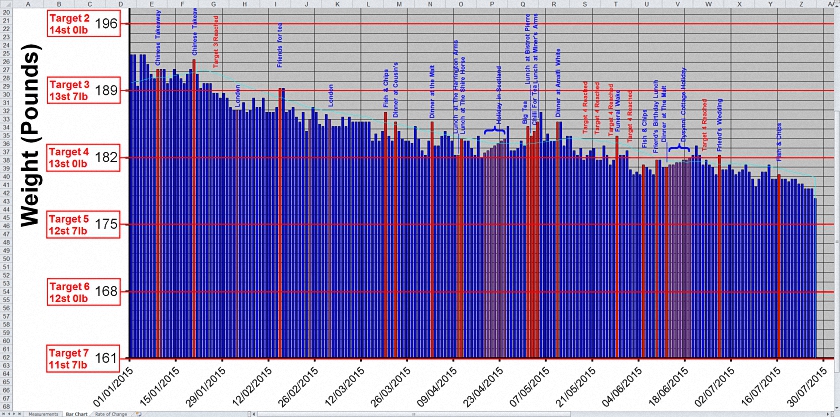
My Weight Is Reducing Slowly But Surely
Introduction Since my last post on body weight (Excel Templates for Body Weight Records) I have continued to try and lose weight. Well slowly but surely my weight is reducing and I have my latest graph to demonstrate it below (select it to enlarge it): I have struggled to lose 35 pounds (2½ stones) over…
-
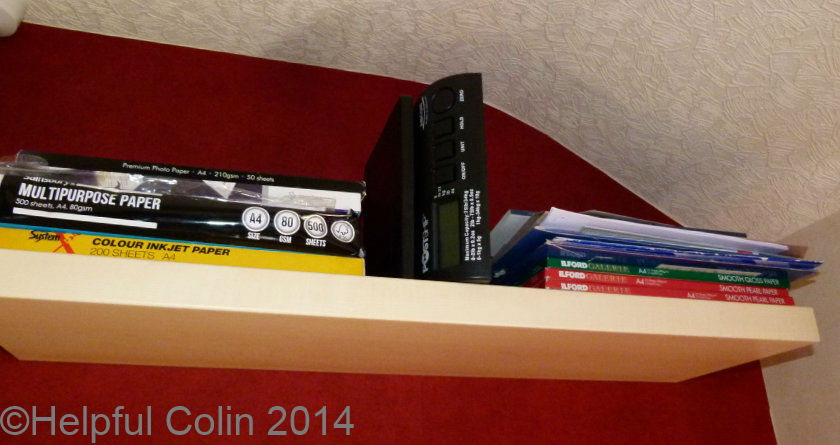
ABCON® PostShip® Parcel Scales Review
Preface This post describes: The design, usage and benefits of ABCON® PostShip® parcel scales.
-

Heating May Make Us Fat!
The title ‘Heating May Make Us Fat’ has no spelling mistake. Check out this article at the BBC where Dutch researchers at the Maastricht University Medical Centre recommend heating homes to no more than 19°C (66°F) because: Heating May Make Us Fat. Below that temperature (19°C) they say our bodies continue to burn calories to keep…
-
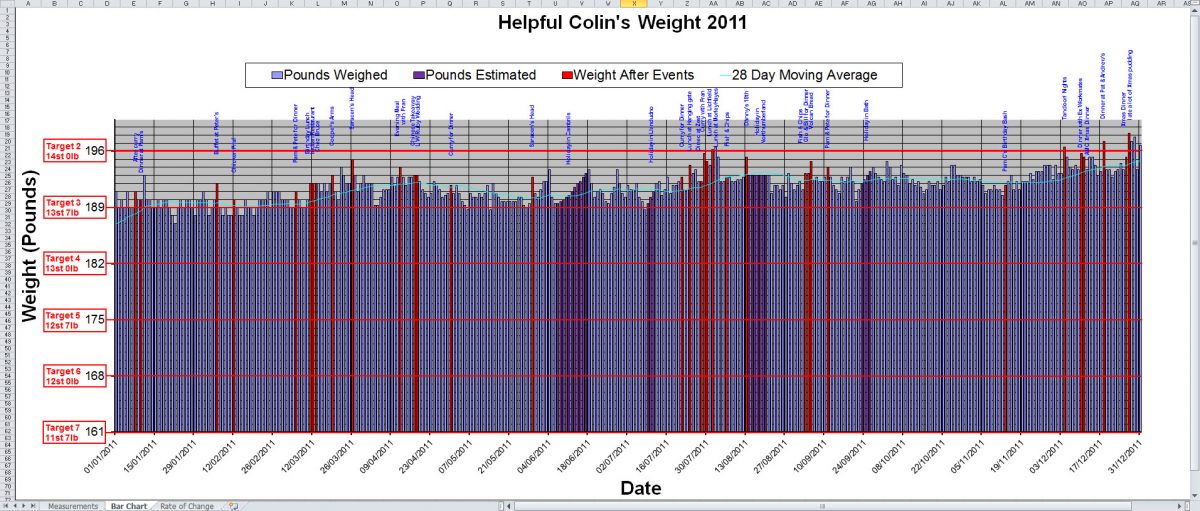
Excel Body Weight Templates To Record Your Weight
“Happy New Year! In 2012 I resolve to lose weight (again).” Well I resolved to lose weight every year since at least 2005 and some years I succeeded. One tool I require for this is a spreadsheet to accurately record of my weight. I use Excel for this and I’ve produced some Excel Body Weight Templates…